1st Faculty of Medicine Charles University 1st Faculty of Medicine Charles University Institute of Physiology
ekuri 04.04.2024

EKG at Final Exam

Physiology ECG Revision

Why and How

sample test


Why?

Based on feedback from clinics, who uniformly complain about substantial lack of knowledge of ECG by medics it was suggested that more attention is drawn to this issue. Medical Physiology course covers the topic extensively (lecture, lab). Further, a compulsoru-eligible subject is offered.

As a routine part of practical exam in Physiology Final everyboody will be required to describe one ECG curve. We believe that this will result in: more thorough revision, better retention of knowledge, improved clinical skills before getting to clinics and more.

The aim of this revision is that 2nd year students demonstrate their basic knowledge of ECG analysis, i.e.: rate, regularity, rhythm, AV conduction and axis. Aditionally students are required to distinguish whether PQRST morphology is normal or not. It is expected that 10 minutes is more than enough to describe the curve as required.

Majority of the exam curves are not physiological. However, there is no difference in determining rate, regularity, conduction and axis comapred to physiological electrocardiogram. Thus it should not be objected that electrograms include also pathologies.


How?

Besides studying principles of ECG (see lectures, lab notes, internet) pay extra attention to practical application, i.e. how to read real curves.


In general:

It is expected:

It is NOT expected:

- Understanding basics  of ECG
- Physiology - level knowledge only
- Brief description of required items.

- Just memorizing some ECG curves
- Knowledge of PathPhys or  detailed Cardiology
- Making ANY diagnosis based on ECG


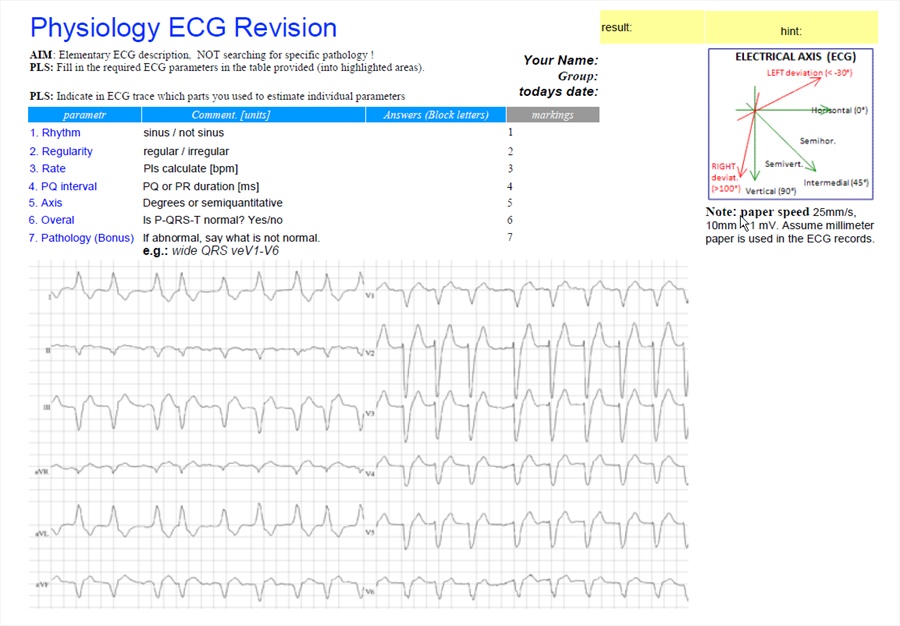
Required description:

what is required

how

Rhytm

sinus /not sinus

This may the be hardest part!

  • in ECG strip, find long trace (usually the last curve)
    lead II or V1 is recmmended for P search
  • there dentify P waves and their relation to QRS
  • P should be regular rate
  • all Ps should look the same
  • All Ps followed by QRS and vice versa
  • PR interval shld be cca 160 ms and constant

Regularity

regular /irreg

  • just have a look! - is RR (approximately) constant?

Rate

pls calculate[bpm]

  • calculate from RR (better 2RR) and paper speed (25mm/s)
  • if rare is variable, introduce MAX and MIN rate in the strip

PQ interval

PQ or PR duration [ms]

  • onset of P to onset of QRS (either Q or R)
  • count number of squares and convert to time

Axis

degrees or semiquantitative

  • determine "average" QRS amplitude (all positive minus all negarive deflections)in I and aVF (not so accurate, but sufficient)
  • combine the vectors obtained. Hint: they're perpendicular ;-)
  •  use degrees or just words: 

axis2.gif


P-QRS-T

is all normal? yes/no

  • you certainly know what is   normal P, PQ, QRS, ST, T
  • mind, that in each lead P QRS T may/should look (very) different.This is due to (very) different orientation of the leads
  • thus in some leads many waves may be negative - still normal!
    e.g. aVR, V1.
  • specifically notice
    • PQ - is it 120-200 ms? (you've done so before)
    • QRS
      • is it narrow? (<120 ms)
      • isn't it tooooo tall (>35 mm)
    • ST- is it isoelectric? i.e. not elevated or depressed?
    • P - is not it negative where positive is expected?
  •   if abnormal, say what is not normal.
    e.g.: wide QRS in V1-V6
    • it will be appretiated if you recognize, what's certainly not normal.
    • just where and what it is. NOT what it means.
      e.g. ST elevation in I, aVL
    • in most curves there is obvious pathology
    Note: paper speed 25mm/s
    10mm = 1 mV


    Click on the picture below to see one of the examples of ECG taken on exam


    number of views: 10247 author: ekuri, last modification: ekuri, 04.04.2024
    Page ranking: (by 24 users) If you think the article is not up-to-date, click here.